1. Experimental setup
1.1 The cell
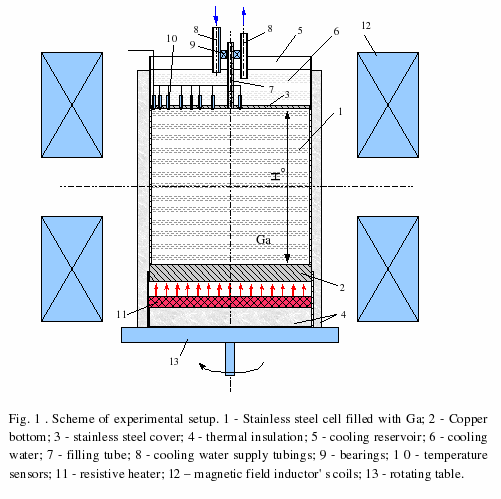
Schematic representation of the setup is shown on Fig. 1 . Cylindrical cell with wall thickness 1.5 mm made of stainless steel ( AISI304) with inner diameter of 1 50 mm equal its height and 16 mm thick copper bottom was filled with 99. 99% pure Gallium melt. Upper surface of the melt was covered with 3 mm thick stainless steel cover with rubber sealing along its perimeter. Inner surfaces of the copper bottom and cover were painted with very thin layer of electrically insulating paint.
Resistive heater made from NiCr wire was placed below the bottom of the cell at 2 cm distance. Maximum heating power was 420 W. Outer surfaces of the cell and heater were thermally insulated by 2 cm thick kaolin fiber layer to prevent heat loses and direct all the thermal flux from the heater to the vertical direction.
Cooling of the top surface was realized with water supplied from thermostat. Water was pumped in and out of the cooling reservoir located above the top cover of the cell with the same flow rate ensuring constant water level in the cooling reservoir. The use of reservoir with open surface of the coolant instead of complex system with hydraulic coupling for entering the coolant into the rotating system is much simpler and allowed to establish relatively high water fluxes and more uniform temperature distribution along the cooling surface.
Rotation of the cell was realized by placing it on rotating table (Fig. 5) . Rotation rates could be varied in the range of 0. . . 60 rpm.
General view of the facility is shown on Fig. 2 - 3.
1.2 Measurement technique
To register fluctuations of the temperature inside the melt 15 small thermistor probes (YSI Inc./32A12) with diameter of 1.5 mm were installed at the inner surface of the upper cover. Specially designed 15 DC current sources supplied 10 µA current to each probe. Four Data Translation DT-982 1 24-bit high resolution USB acquisition boards were used to register voltage from the thermistors. We have calibrated all the thermistors before experiments by putting them into the bath of thermostat and registering the voltage values at the different temperatures in the working range 303. . . 353 K and then fitting calibration data with exponential decay law: T = To + T1[exp(-V/t1)], where V - registered voltage at temperature T, t1- parameter of exponent, To and T1 - characteristic values for concrete thermistor.
15 thermistors were distributed along the surface of upper cover of the cell in certain order (Fig. 6) . Eight of the thermistors (5, 11 , 12 , 10, 9, 3, 13) were placed along the arc of radius 40 mm and angle 120o . Another seven probes (0, 1 , 2 , 7, 4, 6, 8) were located along radius of the cover. This way of placement was chosen to get distributions of temperature along radial and azimuthal directions as well as to ensure various possible length scales for finding out scales of turbulent structures in the flow.
1.3 Magnetic fields
The inductor of steady magnetic fields (Fig. 1 , pos. 12) used in experiments to apply two different magnetic field configurations on the melt - axial uniform and ' cusp' ( axially-radial non-uniform) steady magnetic fields. The inductor designed from water-cooled copper tube has two coil groups (0.3 m) with 48 windings in each coil. Axial uniform and 'cusp' field could be created by connecting the coils in series with current direction either the same or opposite in the coils. Maximal axial magnetic induction values achieved (70 mT for uniform and 35 mT for ' cusp' field) were limited by our DC power source with max current value ~570 A for this inductor.
1.4 Procedure of experiments
Series of the experiments were conducted applying constant heating power to the bottom of the cell. Integral heat flux varied from 10 to 420W in different experiments. The temperature of the water in cooling reservoir kept constant with thermostat. Different experiments were done applying different rotation rates of the container, steady magnetic field type's and induction values.
1.4.1 Non-rotating container
1.4.2 Rotating container
1.4.3 Rotating container with 'cusp' steady magnetic field 35 mT
1.4.4 Rotating container with 'axial' uniform steady magnetic field 35 mT
FIGURES

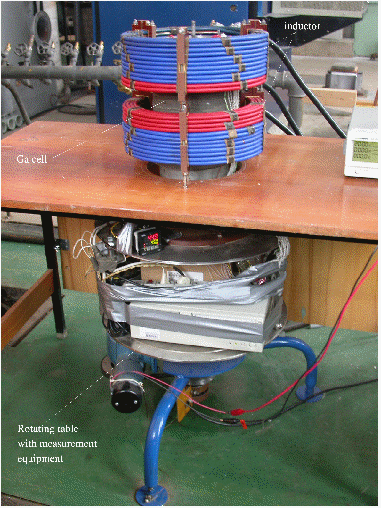
Fig.2 General view of the experimental facility.
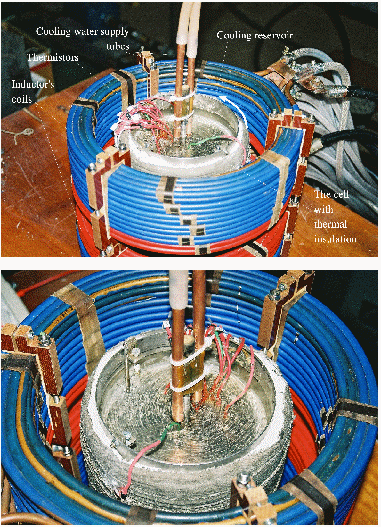
Fig. 3 Gallium cell with water-cooling system.
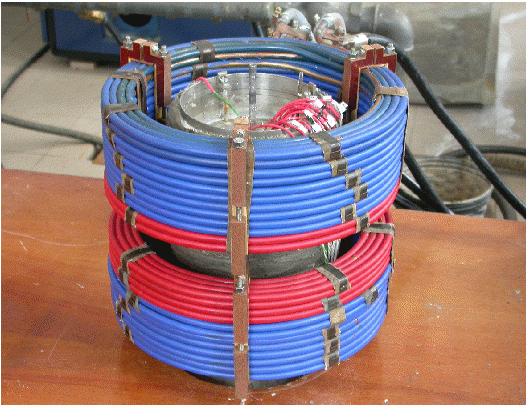
Fig. 4 Inductor of magnetic fields.
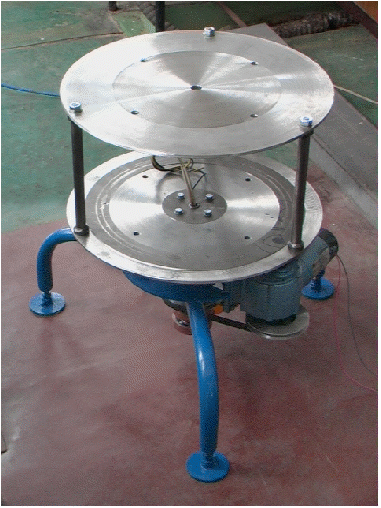
Fig. 5 Rotating table.
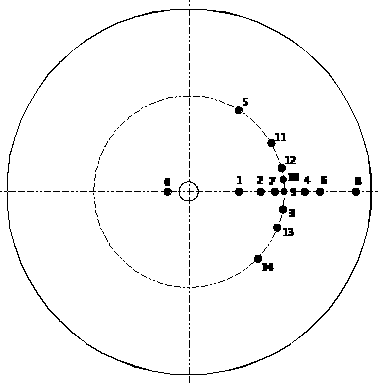
Fig. 6 Layout of the thermistors in the upper cover of the cell.